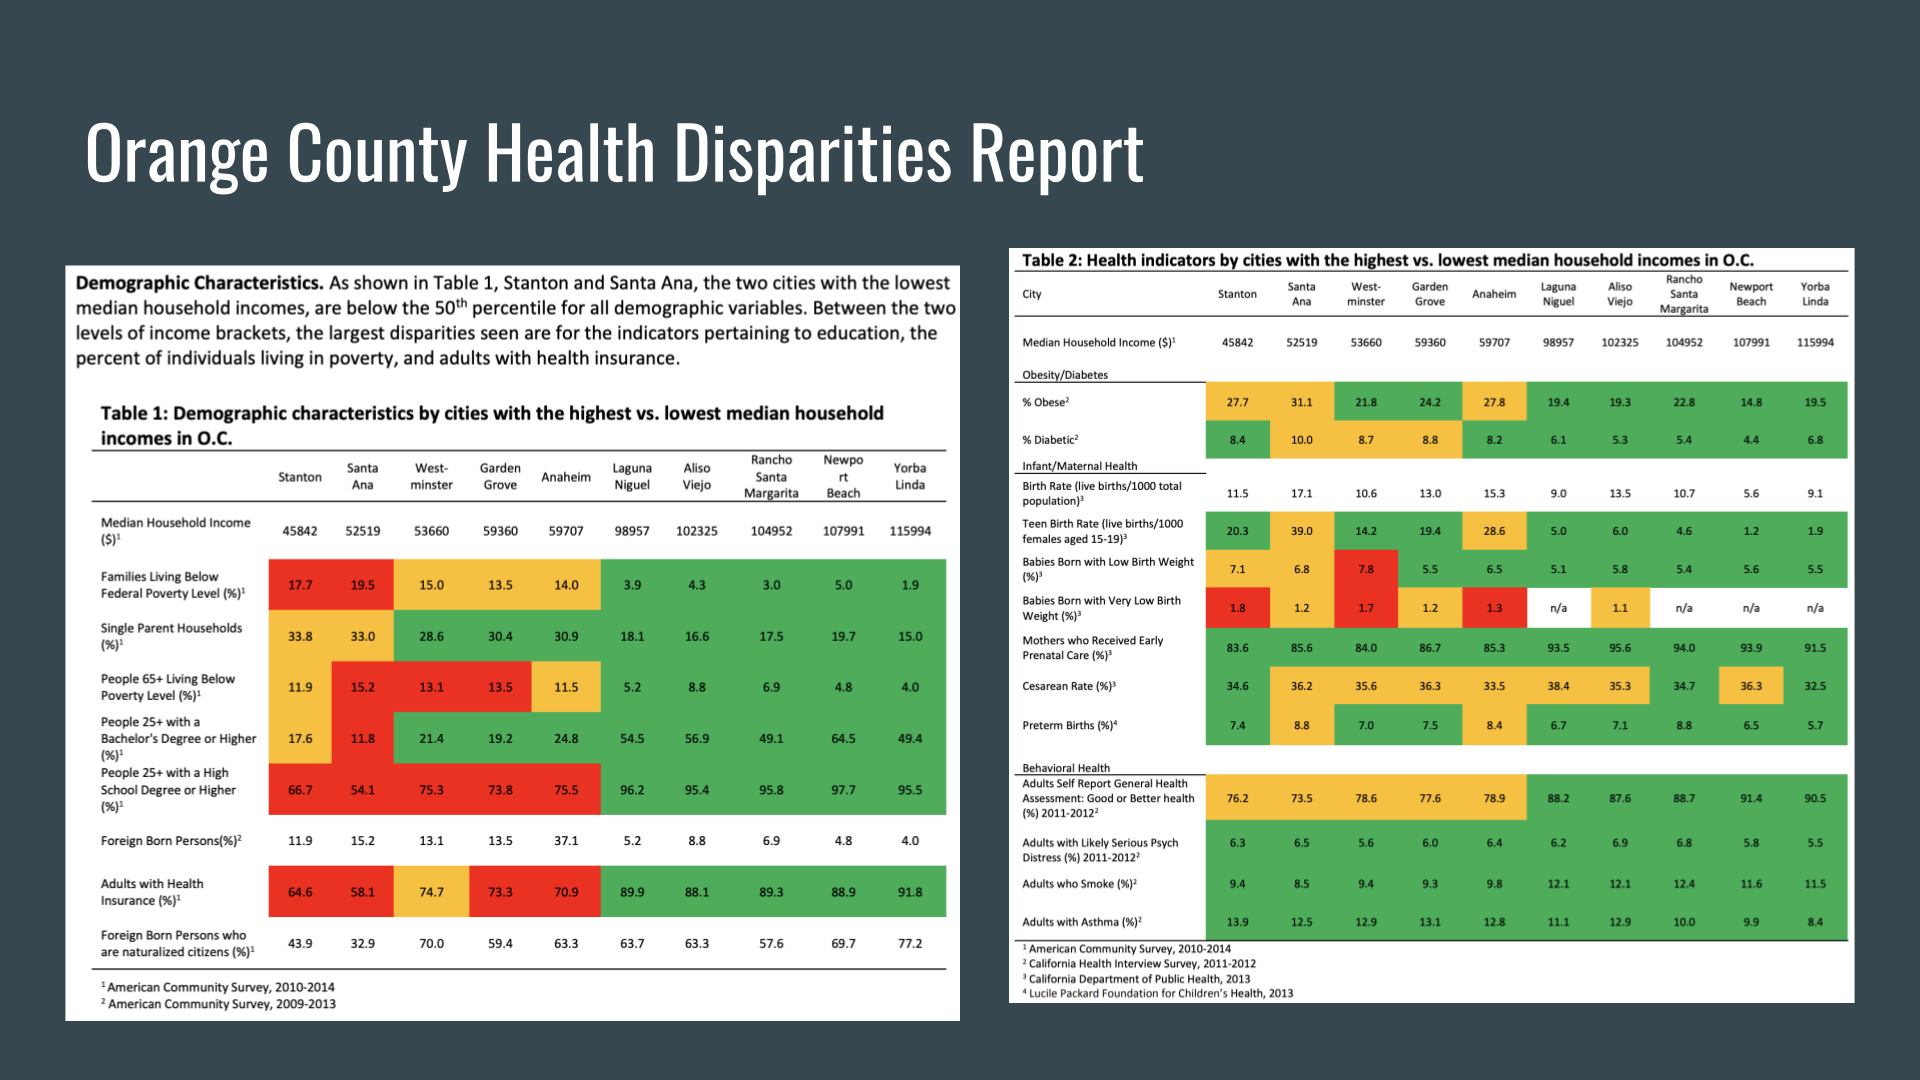
Systematic differences in health can be seen between cities of different median household income, and between individuals of different race/ethnicity. This report highlights the cities and racial/ethnic populations of highest need, and underscores the importance of further efforts to understand and address health disparities to achieve health equity among all residents of Orange County
source: https://www.ochealthiertogether.org/content/sites/ochca/OC_Health_Dispar...
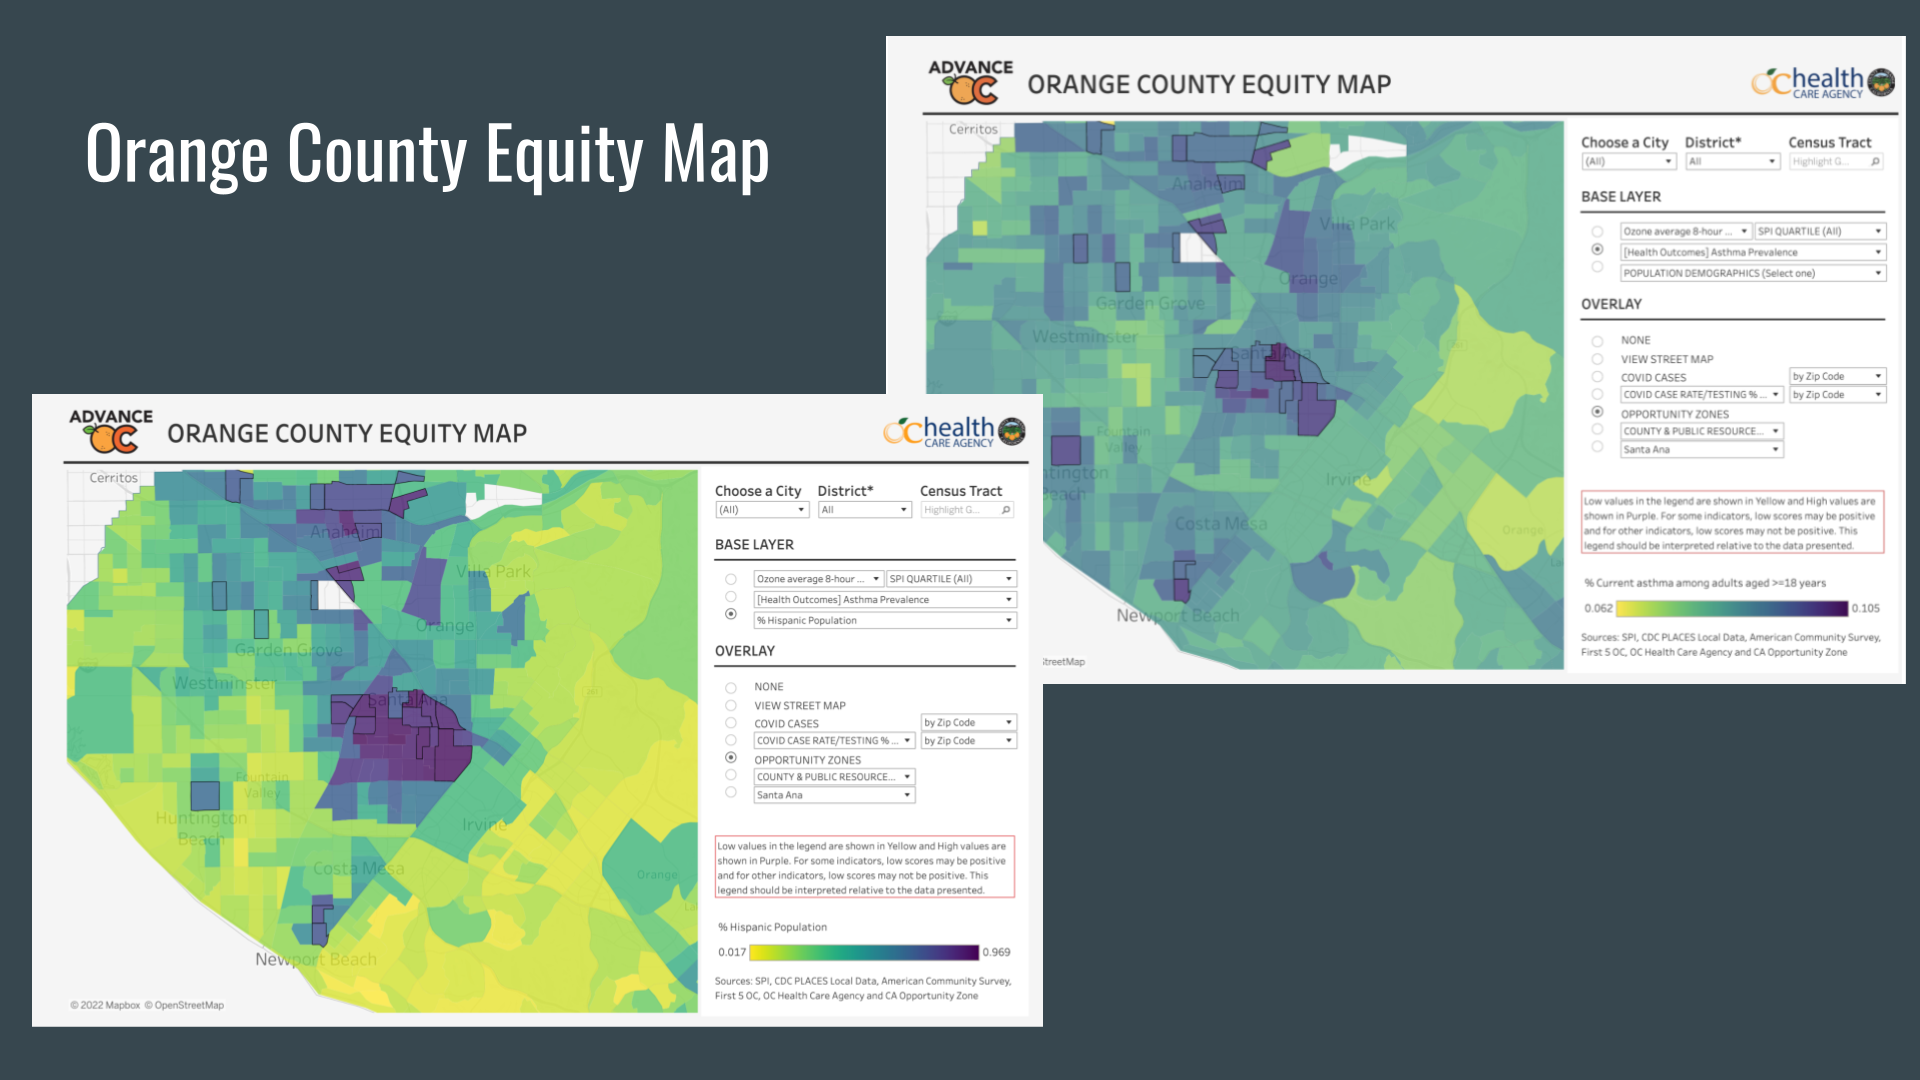
Opportunity Zones are census tracts that are economically-distressed communities where new investments may, under certain conditions, be eligible for preferential federal tax treatment or preferential consideration for federal grants and programs

Conduent Healthy Community Institute's Food Insecurity Index is calculated using social and economic factors ranging from household expenditures to perceived health status that may impact a household's ability to access and purchase food. Based on these factors, an index value (from 0 - 100) is generated for each zip code, census tract, and county in the nation. Communities with the highest values are estimated to have the highest food insecurity, which is correlated with household and community measures of financial stress, such as Medicaid enrollment, SNAP enrollment, and mental health burden.
The SocioNeeds Index takes social and economic factors that are well known to be strong determinants of health outcomes (which range from poverty to education), and generates an index value (from 0 - 100) for each zip code, census tract, and county in the nation. Those with the highest values are estimated to have the highest socioeconomic need which is correlated with preventable hospitalizations and premature death
“The California Healthy Places Index (HPI) is a powerful new tool, developed by the Public Health Alliance of Southern California, to assist you in exploring local factors that predict life expectancy and comparing community conditions across the state.”
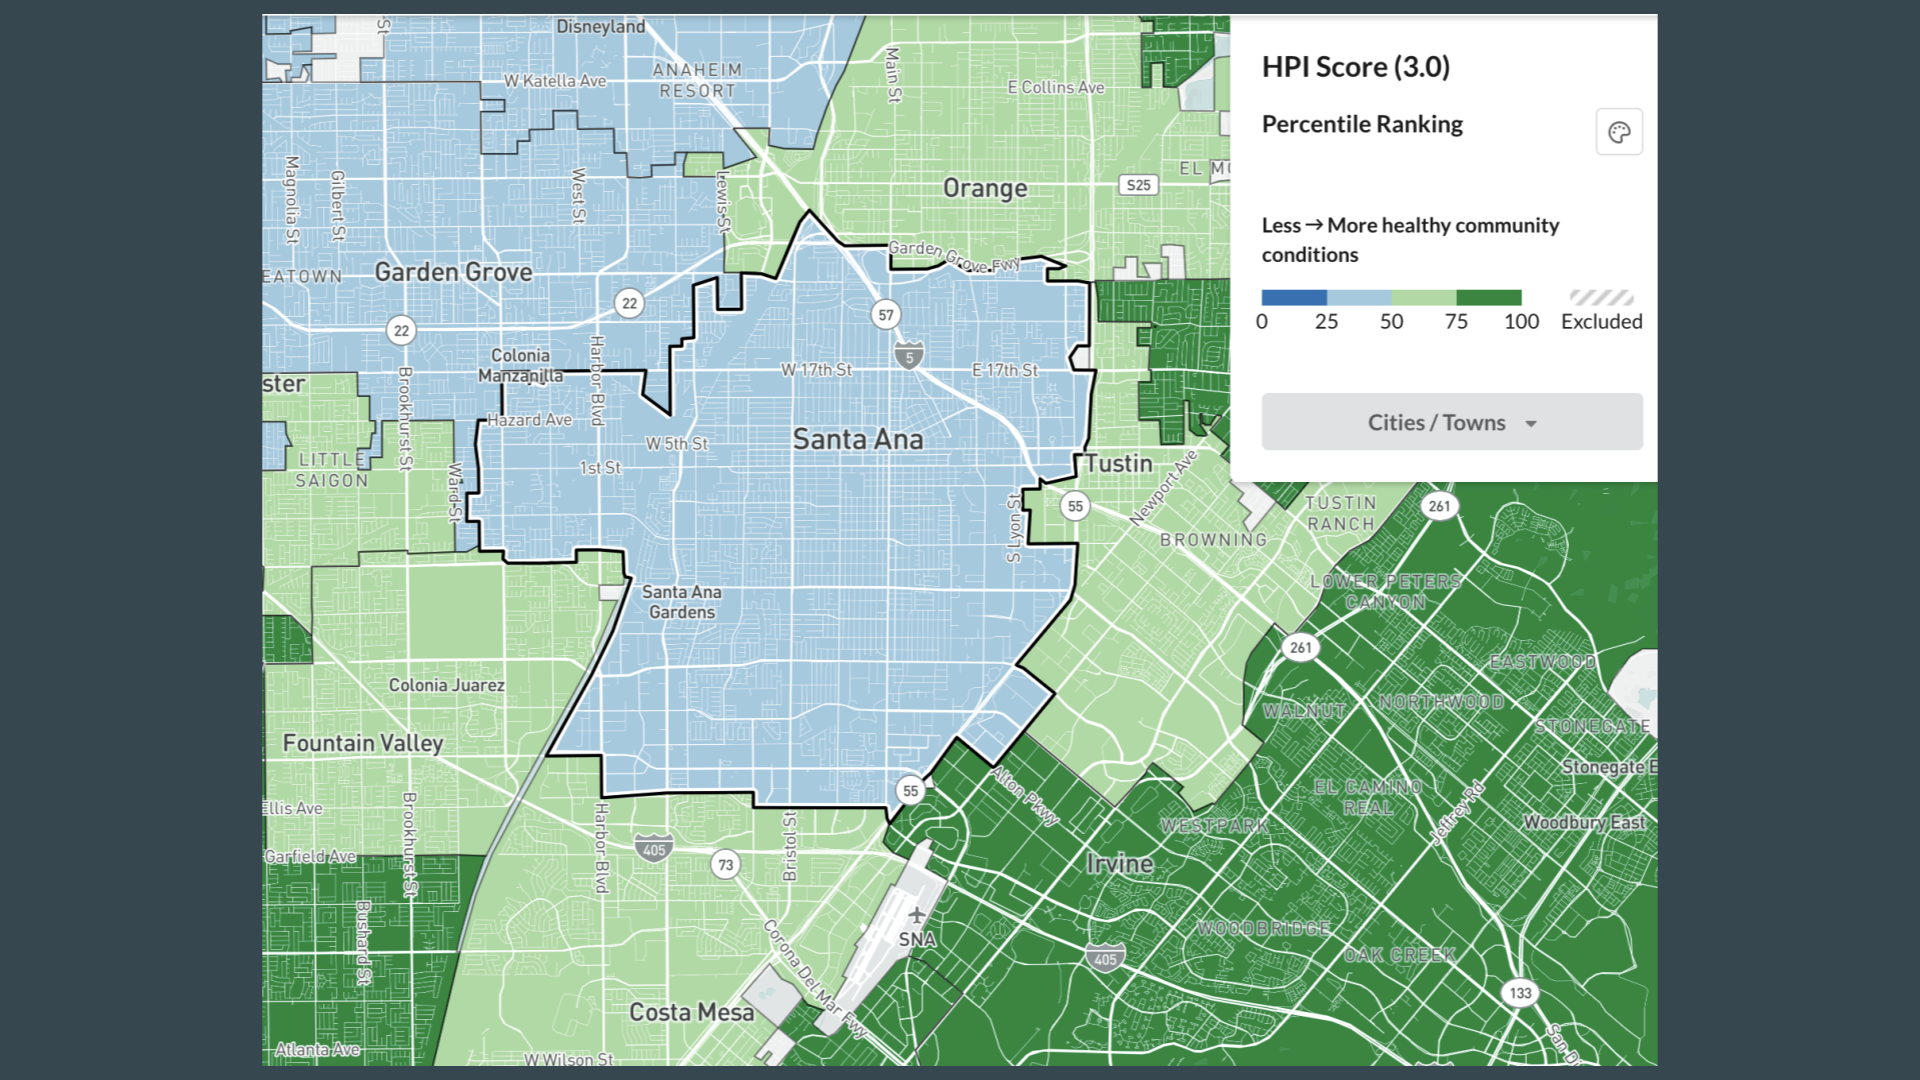
It showcases community conditions that predict life expectancy and influence health. People’s health is shaped dramatically by “non-health” policies and community characteristics, such as housing, education, economic, environmental, and social factors. These community conditions are called the “social determinants of health”, which inform the indicators used on the HPI platform.
The Orange County Community Indicators report of 2015, reported an “opportunity gap” seen in “abundant support and resources for the children of higher-income families and stalled or declining social mobility for the children of lower-income and less educated families” (American Family Housing 2015). Although an improving economy generates high-paying jobs for the educated, a housing shortage for the middle class and the poor caused, in part, by a 6 percent drop in the county’s median income between 2006 and 2013, where “lower-paid occupations such as administrative assistants and retail sales clerks declined, and salaries for such higher-paid jobs as computer programmers rose,” along with a growing proportion of Latinos in Orange County where “the academic gap between Latino students and their classmates “remains substantial and persistent, showing little lasting improvement,” (American Family Housing 2015) shows the significance of educational disparity in determining financial security and consequently, health outcomes
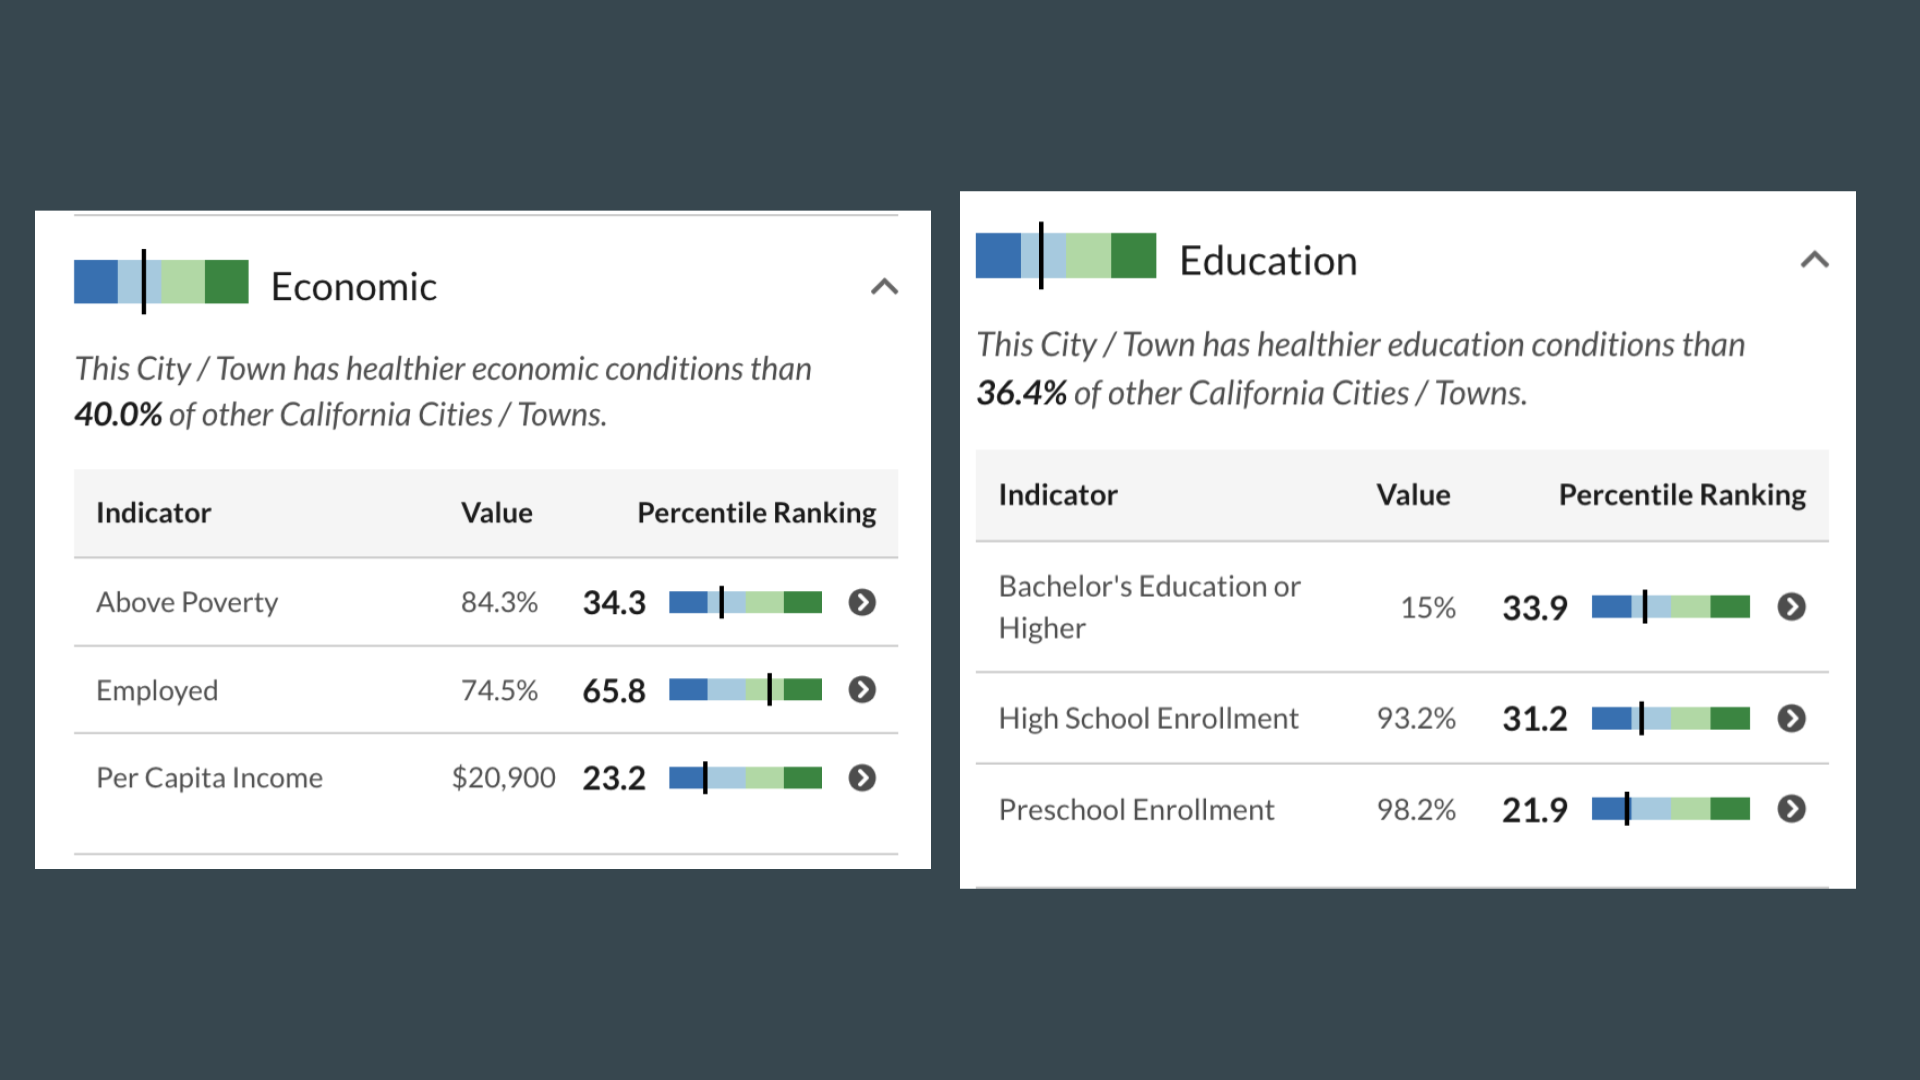
Research indicates that economic opportunity is one the most powerful predictors of good health, and that impacts on health are especially pronounced for people in or near poverty.
A college education is essential for higher-paying careers; helps people develop the cognitive skills and knowledge necessary to make healthy choices; builds important social and physiological skills.
Early childhood is a crucial period for brain development;
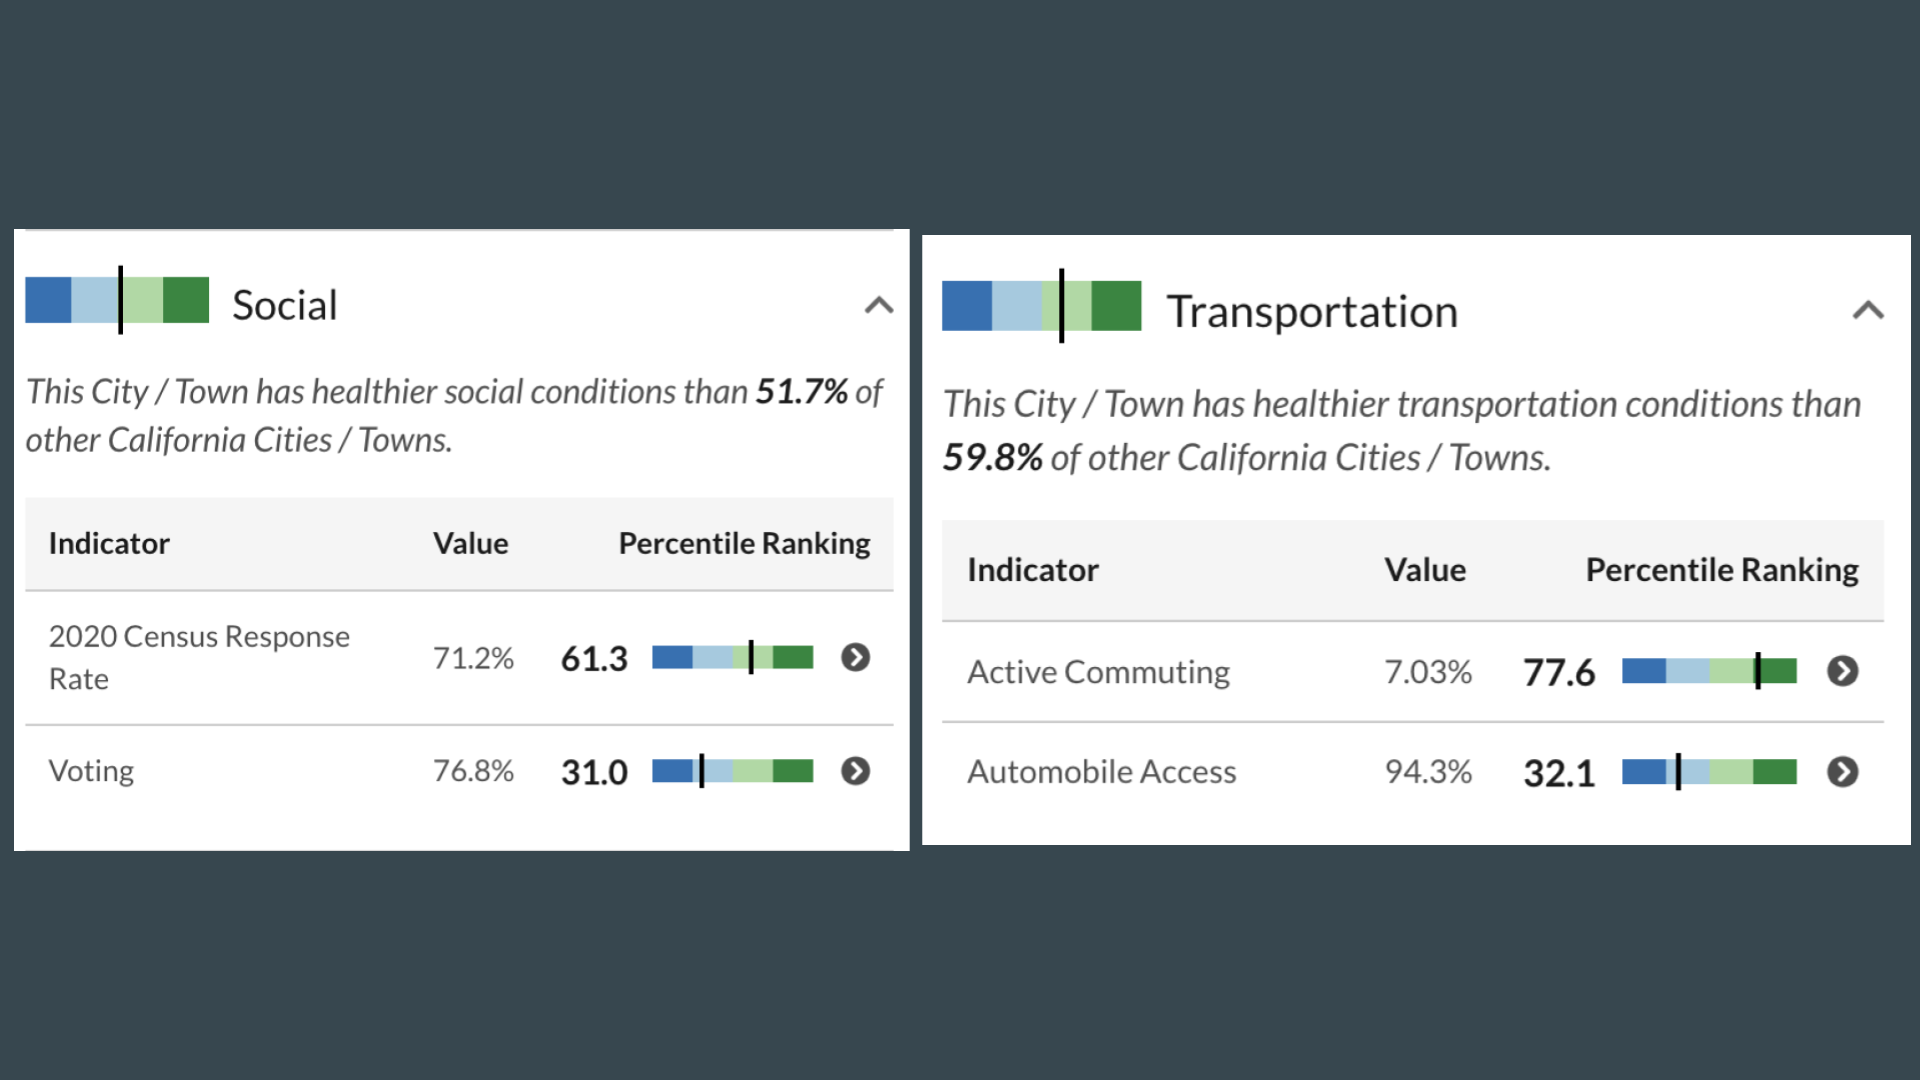
Voting is an indicator of social power and social cohesion, which have been linked to a wide variety of health outcomes at the individual and community levels
Cars are tools of transportation to new opportunities, while people may use a bike, bus, etc, communities with no bike lanes, sidewalks, and other open/green areas are at a disadvantage and will have a hard time being active/ moving around without a car.
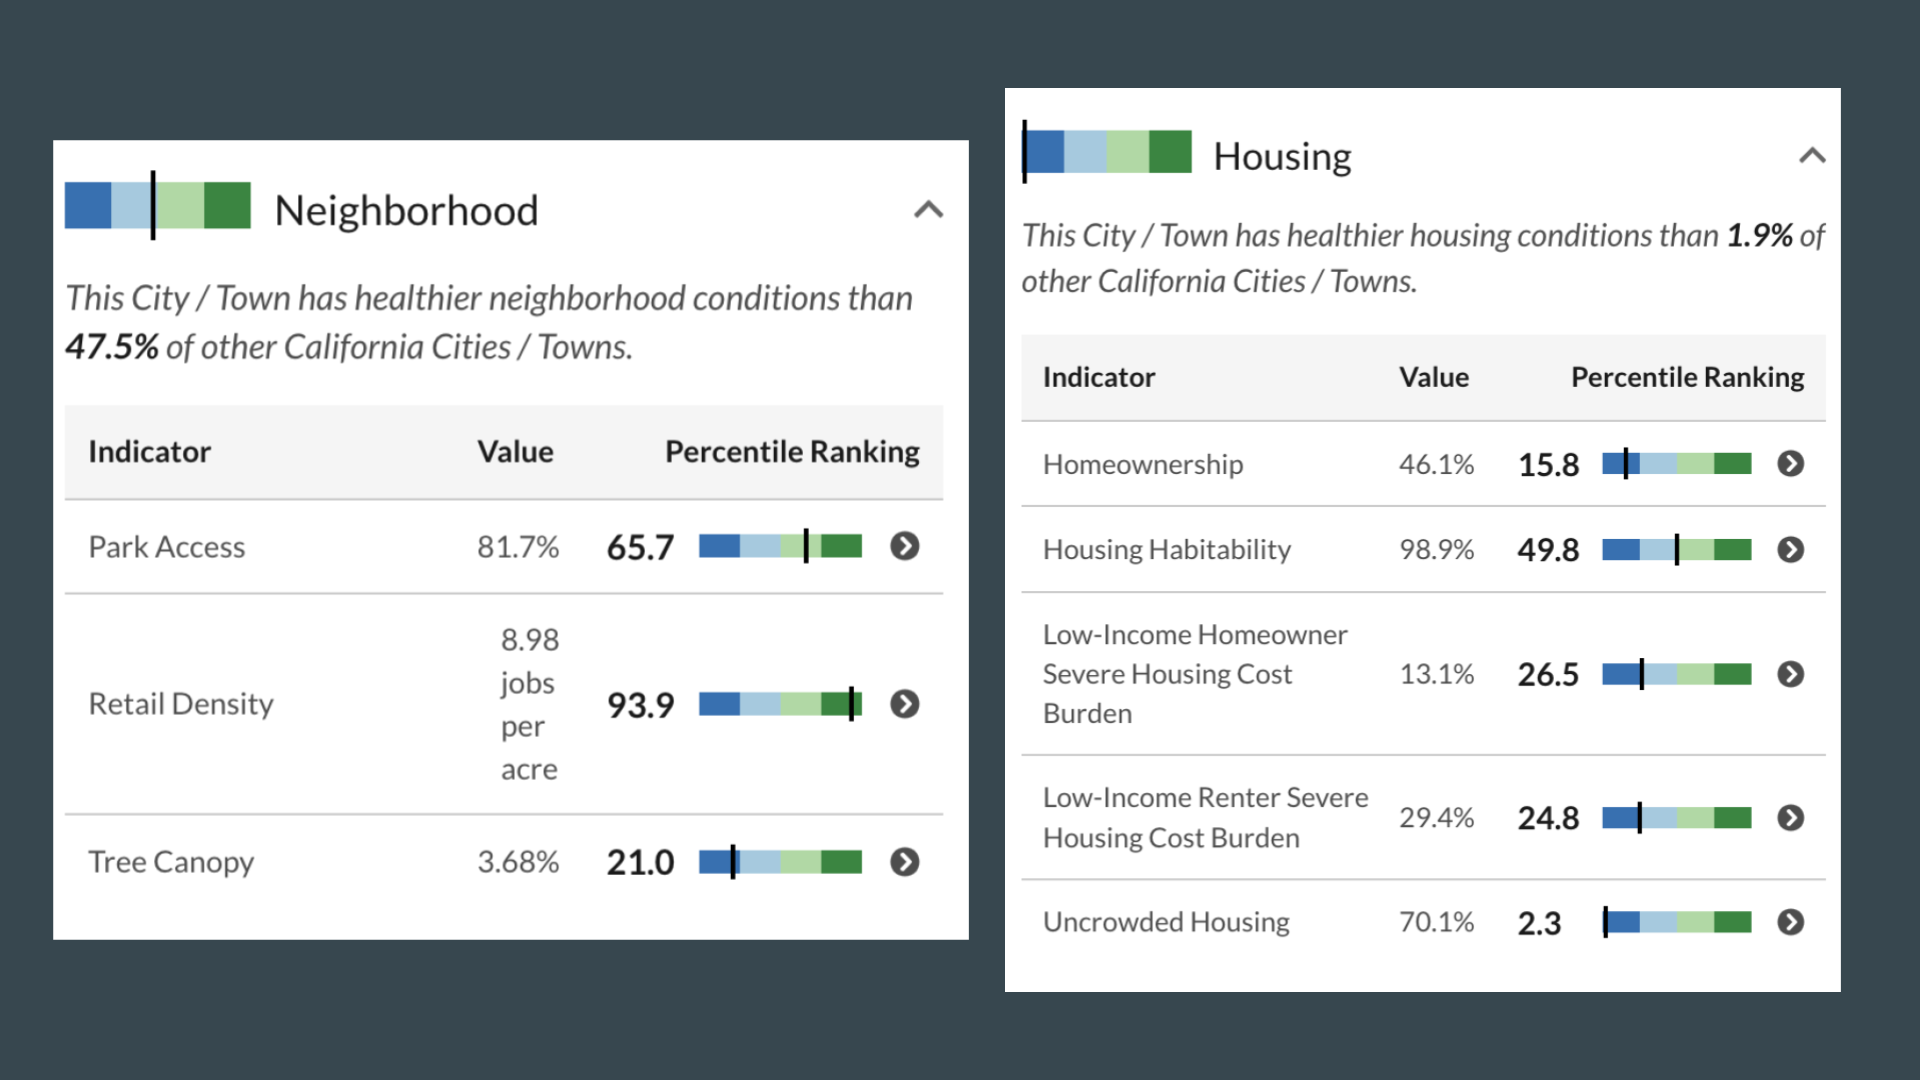
People in the bottom half of poverty percentile are also located in areas that have the lowest percentage of tree canopy, park access, low-Income homeowner severe housing cost burden, and also the lowest percentage of healthcare insured adults.
Trees are beneficial for mental and physical health in many ways. They can provide shade and cool surrounding areas, reduce stress, and promote health, wellness and physical activity. Trees are essential to mitigate the effects of climate change, especially extreme heat events.
Where there is less tress coverage, there are more paved surfaces, like roads and parking lots, that absorb and radiate heat. That adds to up to higher summer temperatures compared to the city average.
Neighborhoods that have been neglected politically and left with no access to green spaces, overcrowded housing, insufficient wages and no access to health care are often composed of underrepresented communities
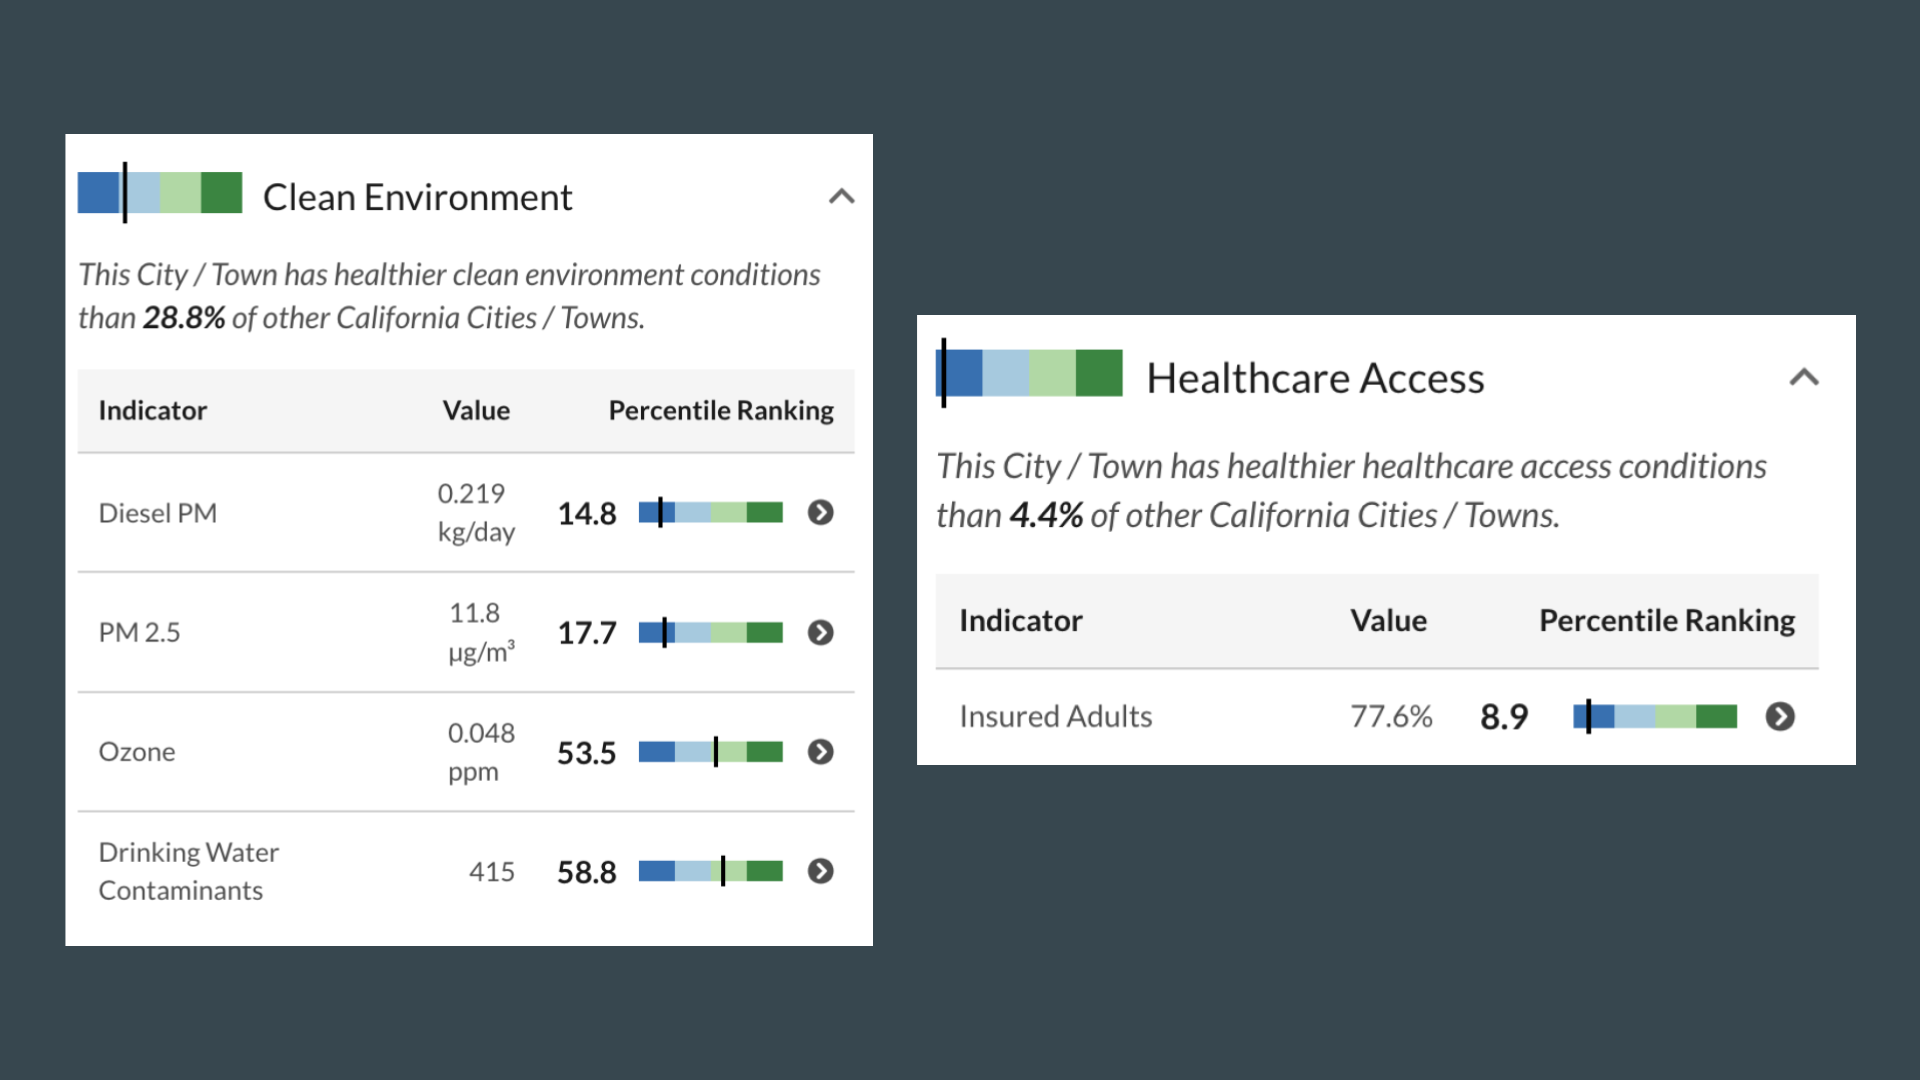
Everyone should have the opportunity to build wealth over time by purchasing a home, which can protect against rising rents and promote social ties and neighborhood stability. High housing costs and housing instability are associated with increased stress and depression, communicable diseases like tuberculosis, and decreased children’s wellbeing and educational outcomes
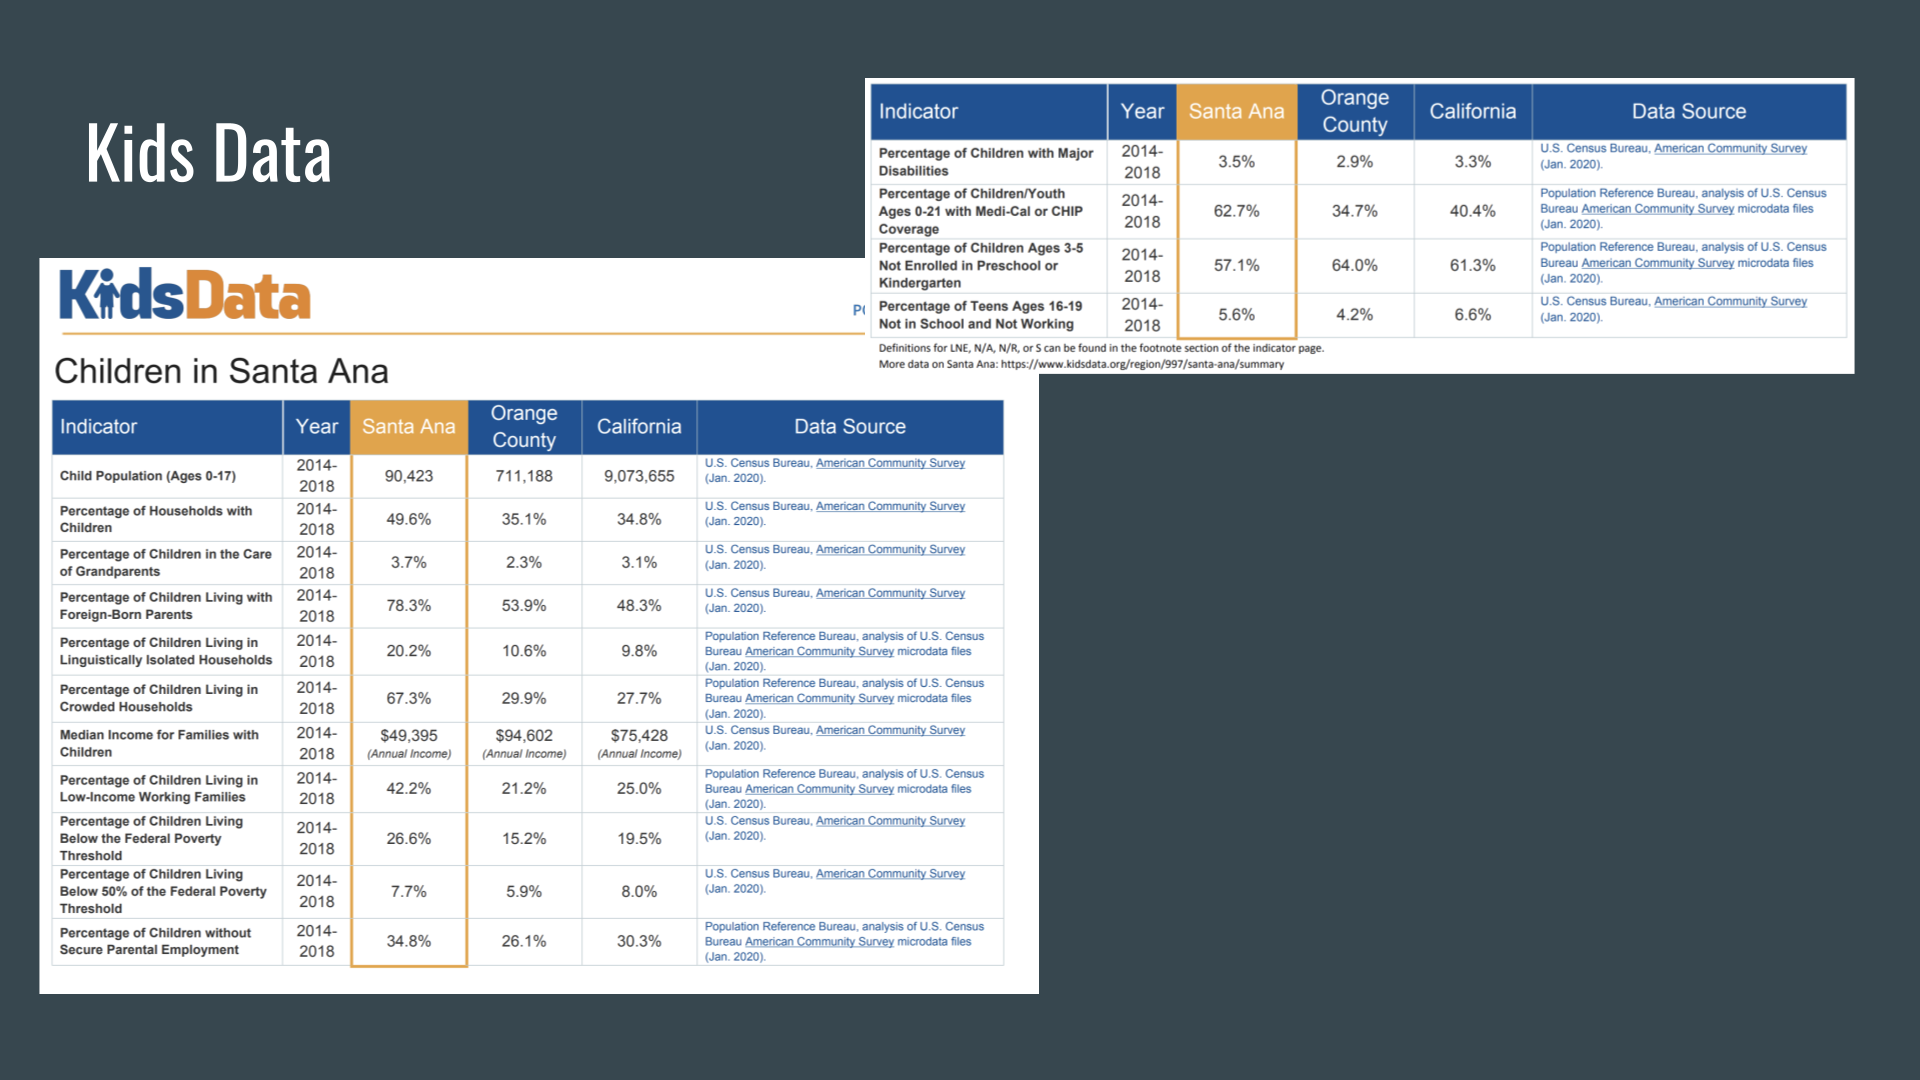
When parents don't have financial support, and aren't able to take time off because of inaccessible insurance and no days off with increasingly higher bills, then their children are more likely to suffer neglect and poverty. This usually means they will grow old in a neighborhood with no environmental regulation and at higher risk of being “high risk.”
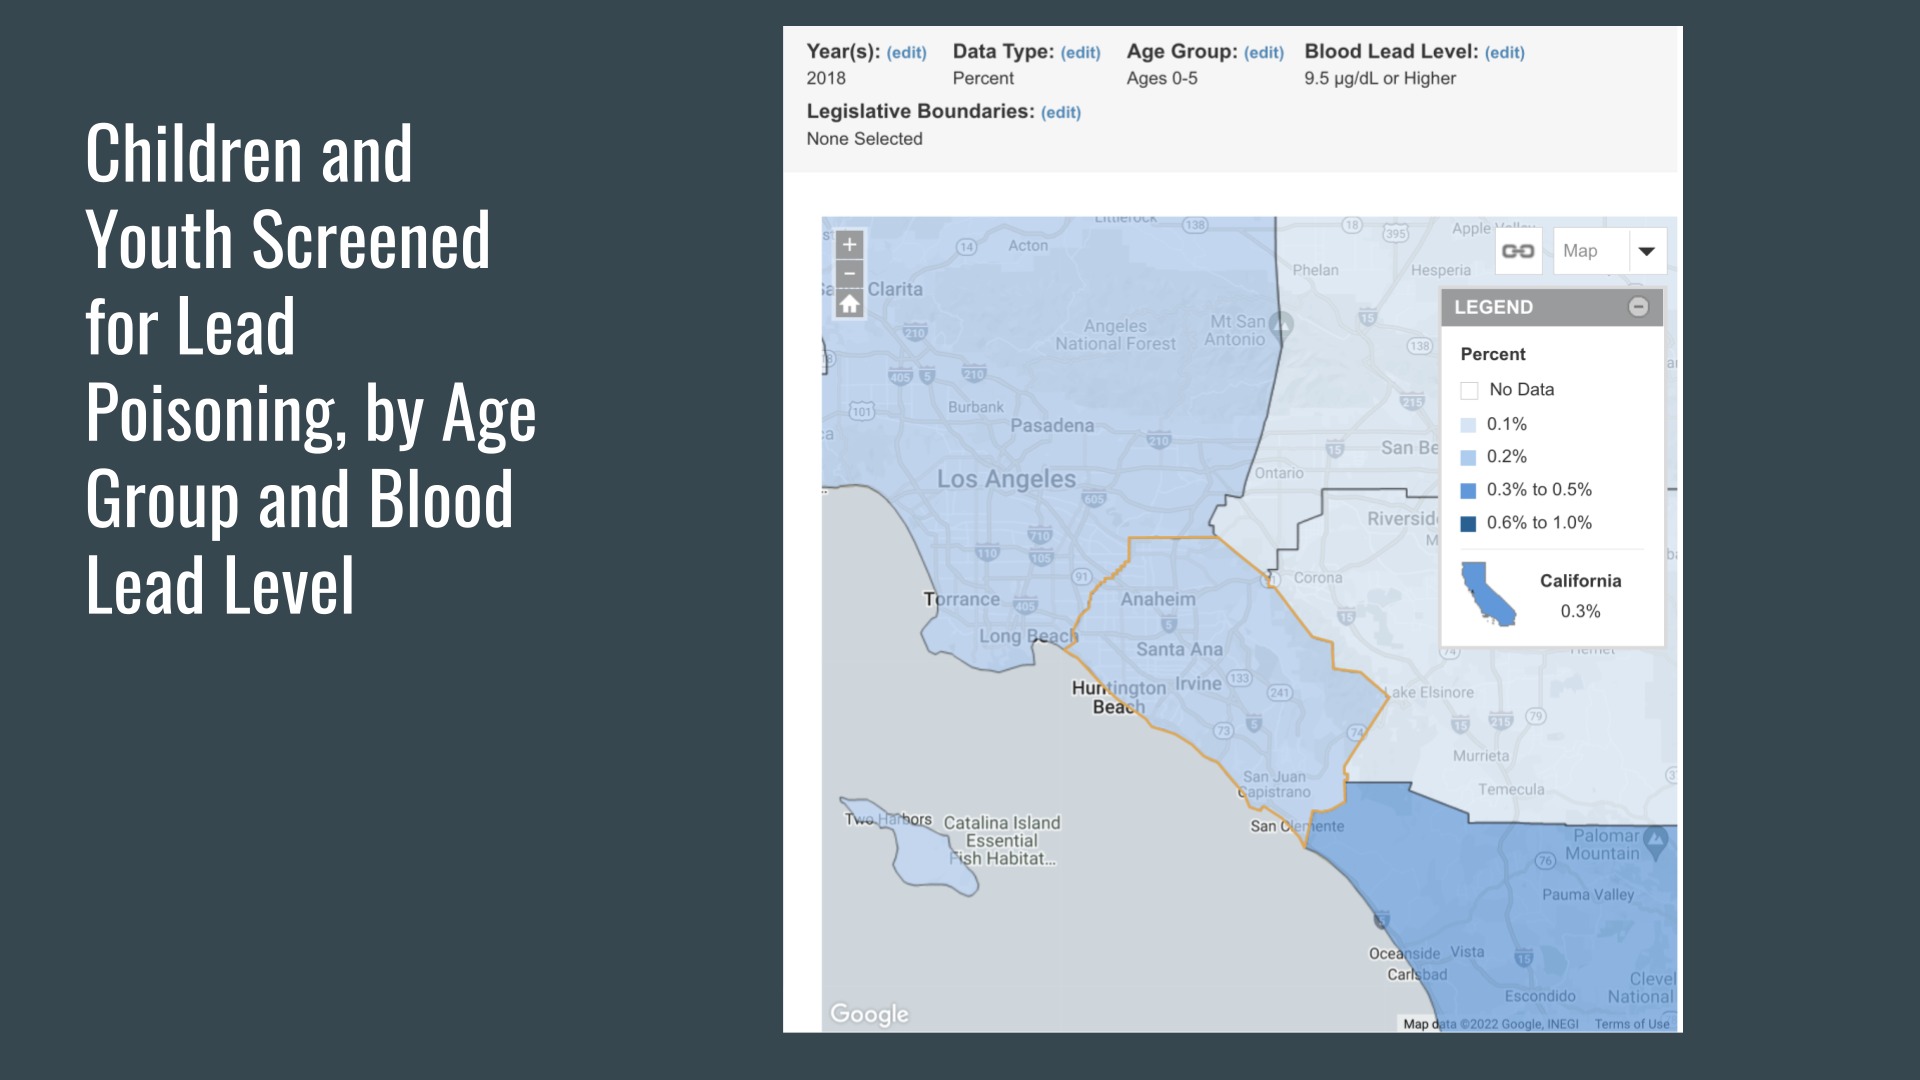
According to 2018 data from kidsdata.org, 1% of children from the ages of 0-5 in Orange County have blood lead levels that are 9.5 µg/dL or higher. Lead exposure in Orange County can be attributed to lead paint exposure in homes and schools, or even in contaminated soil, water, or air.
source: https://www.kidsdata.org/topic/529/blood-lead-level/map#loct=3&fmt=706&l...

Risk Assessment of Soil Heavy Metal Contamination at the Census Tract Level in the City of Santa Ana, CA:
Shown in Fig. 3 is a map depicting Santa Ana Census tracts according to HI scores that were derived using both lower and upper RfD values (see Table 2) where applicable (Mn only). As shown, depending on whether upper or lower RfDs were applied for Mn, between 35 and 61 (57–100%) Census tracts in Santa Ana showed HI ≥ 1, implying the potential for non-carcinogenic health effects across the majority of Census tracts. The pattern of risk was similar across both lower and upper risk scenarios, with the cluster of Census tracts in the central region of the city, just south of the I-5 and SR-22 freeways, showing the highest HI values. When assessing the average concentration of each heavy metal across all sampling points, the cumulative HI for Santa Ana was calculated to be 1.3 under lower risk assumptions.

Table 4 presents the average concentration of each heavy metal according to land use type.
Note how the main contributors to elevated soil concentration of heavy metals come from industries and roadway.

This is the average heavy metal concentrations and 95% CIs (shown as error bars) of heavy metal soil samples based on the median household income across Census tracts.
In terms of social patterning, relative to soil samples collected from the lowest tertiles, soil samples collected in tertiles with: the highest proportion of non-English speaking residents had 66.1% and 24.7% higher Pb and Zn concentrations, respectively; the highest proportion of immigrant residents had 96.4%, 18.8%, 20.9%, and 32.4% higher Pb, Cu, Cd, and Zn concentrations, respectively; the highest proportion of Latina/o/x or Hispanic residents had 105.1%, 17.0%, 20.6% and 32.6% higher Pb, As, Cd, and Zn concentrations, respectively. In contrast, the opposite pattern was observed for Mn where the tertile with the lowest proportion of Latina/o/x or Hispanic residents had 11.5% higher Mn concentrations relative to those from the lowest tertile.
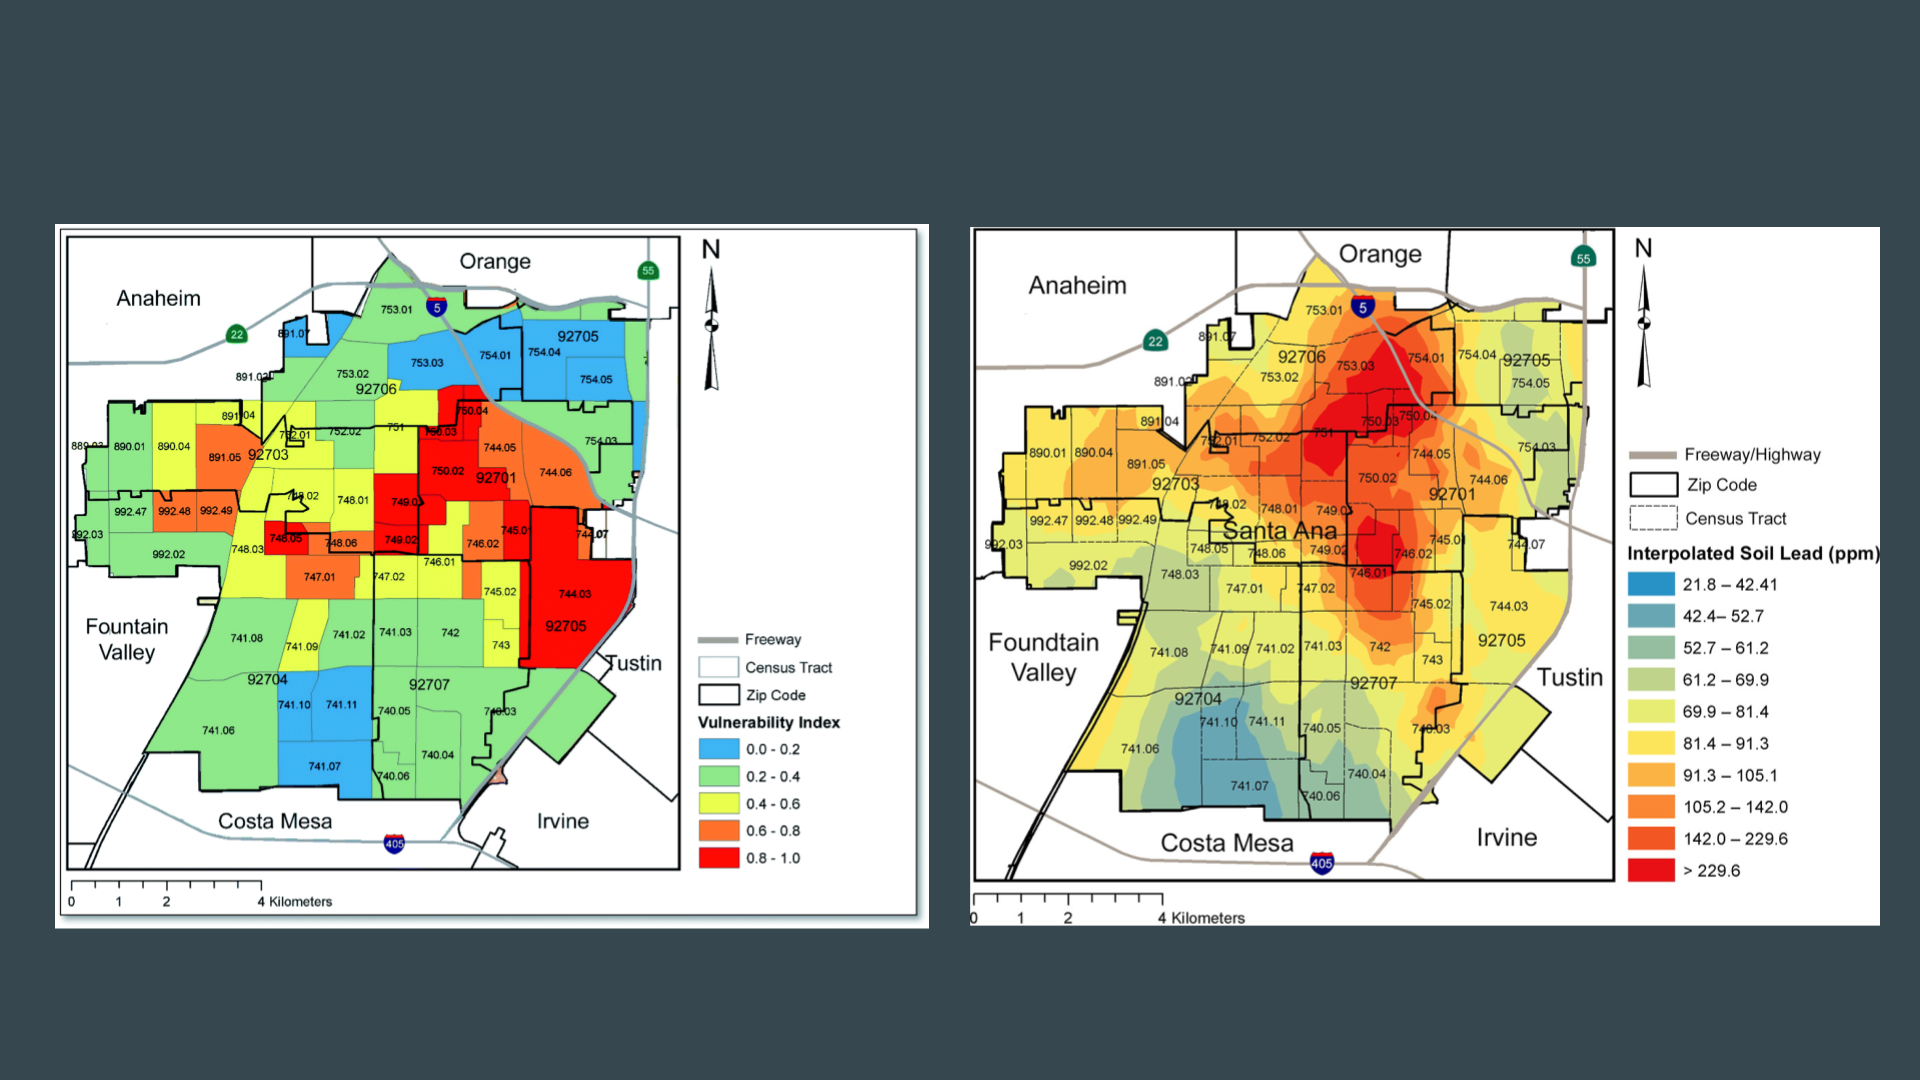
On the left: The vulnerability index is composed of U.S. Census estimates, which may underestimate the population in sub-locales of Santa Ana. For instance, in Santa Ana a sizable proportion of youth and adults of color have engaged with the criminal legal system and thus may not be represented in Census estimates of the population. Any systematic undercounts of the population may contribute to conservative estimates of the cumulative burden of exposure to metals. Further, Santa Ana is experiencing a gentrification process that has augmented housing instability, homelessness, and housing quality concerns that may also contribute to population undercounts.
On the right: Presence of lead in the soil (source: https://www.sciencedirect.com/science/article/abs/pii/S0048969720342881)

The following pictures belong to Santa Ana’s city profile in the Notre Dame’s Urban Adaptation Assessment (UAA) interactive database. It has data for five different environmental hazards: flood, heat, cold, sea-level rise, and drought. Each Hazard has a “Potential Future Cost” window that provides information on the historical and projected cost, or casualties, and probability of the hazard occurring in 2040. The data comes from the National Oceanic and Atmospheric Administration and the MACA data portal to estimate the probability of the hazard occurring in 2040.
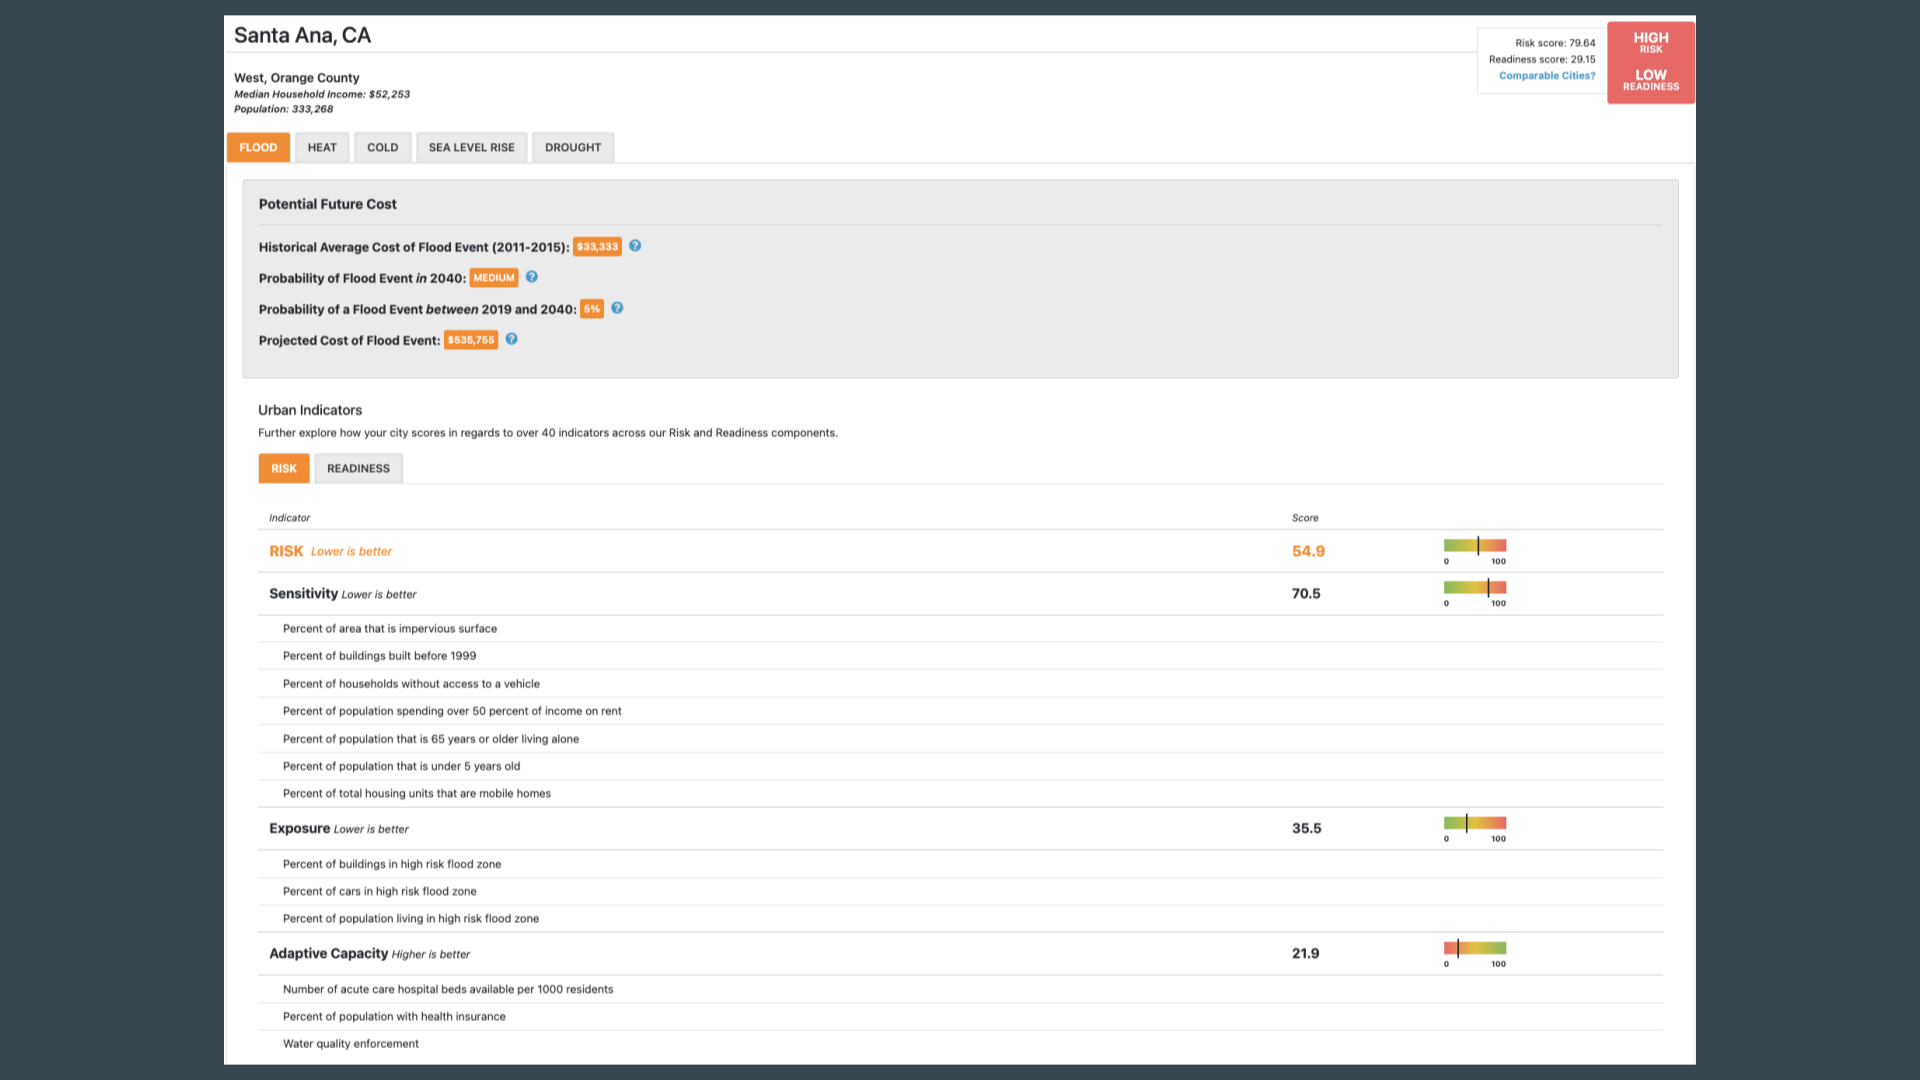
The overall risk at the top provides an indication of how well cities performed in all indicators. It shows how well cities performed on all indicators relative to how other cities performed in the assessment. Santa Ana was measured to have an overall “high risk” score of 79.64 and an overall “low readiness” score of 29.15.
The overall risk score is comprised of sensitivity, exposure, and adaptive capacity. Each categories has its own set of indicators. The colored bar shows where the score fall on a scale of 0 to 100, relative to other cities in the assessment. A lower sensitivity score is better, while a higher adaptive capacity score is better. The green shows the more desirable side.
This image shows Santa Ana has an overall flooding risk score of 54.9. This is based on the following indicators:
The sensitivity score is 70.5. Data points used to measure the indicator include percent of area that is impervious surface, percent of buildings built before 1999, percent of households without access to a vehicle, percent of population spending over 50 percent of income on rent, percent of population that is 65 years or older living alone, percent of population that is under 5 years old, and percent of total housing units that are mobile homes.
The exposure score is 35.5. Data points used to measure the indicator include percent of buildings in high risk flood zone, percent of cars in high risk flood zone, and percent of population living in high risk flood zone.
The adaptive capacity score is 21.9. Data points used to measure the indicator include number of acute care hospital beds available per 1000 residents, percent of population with health insurance, and water quality enforcement.
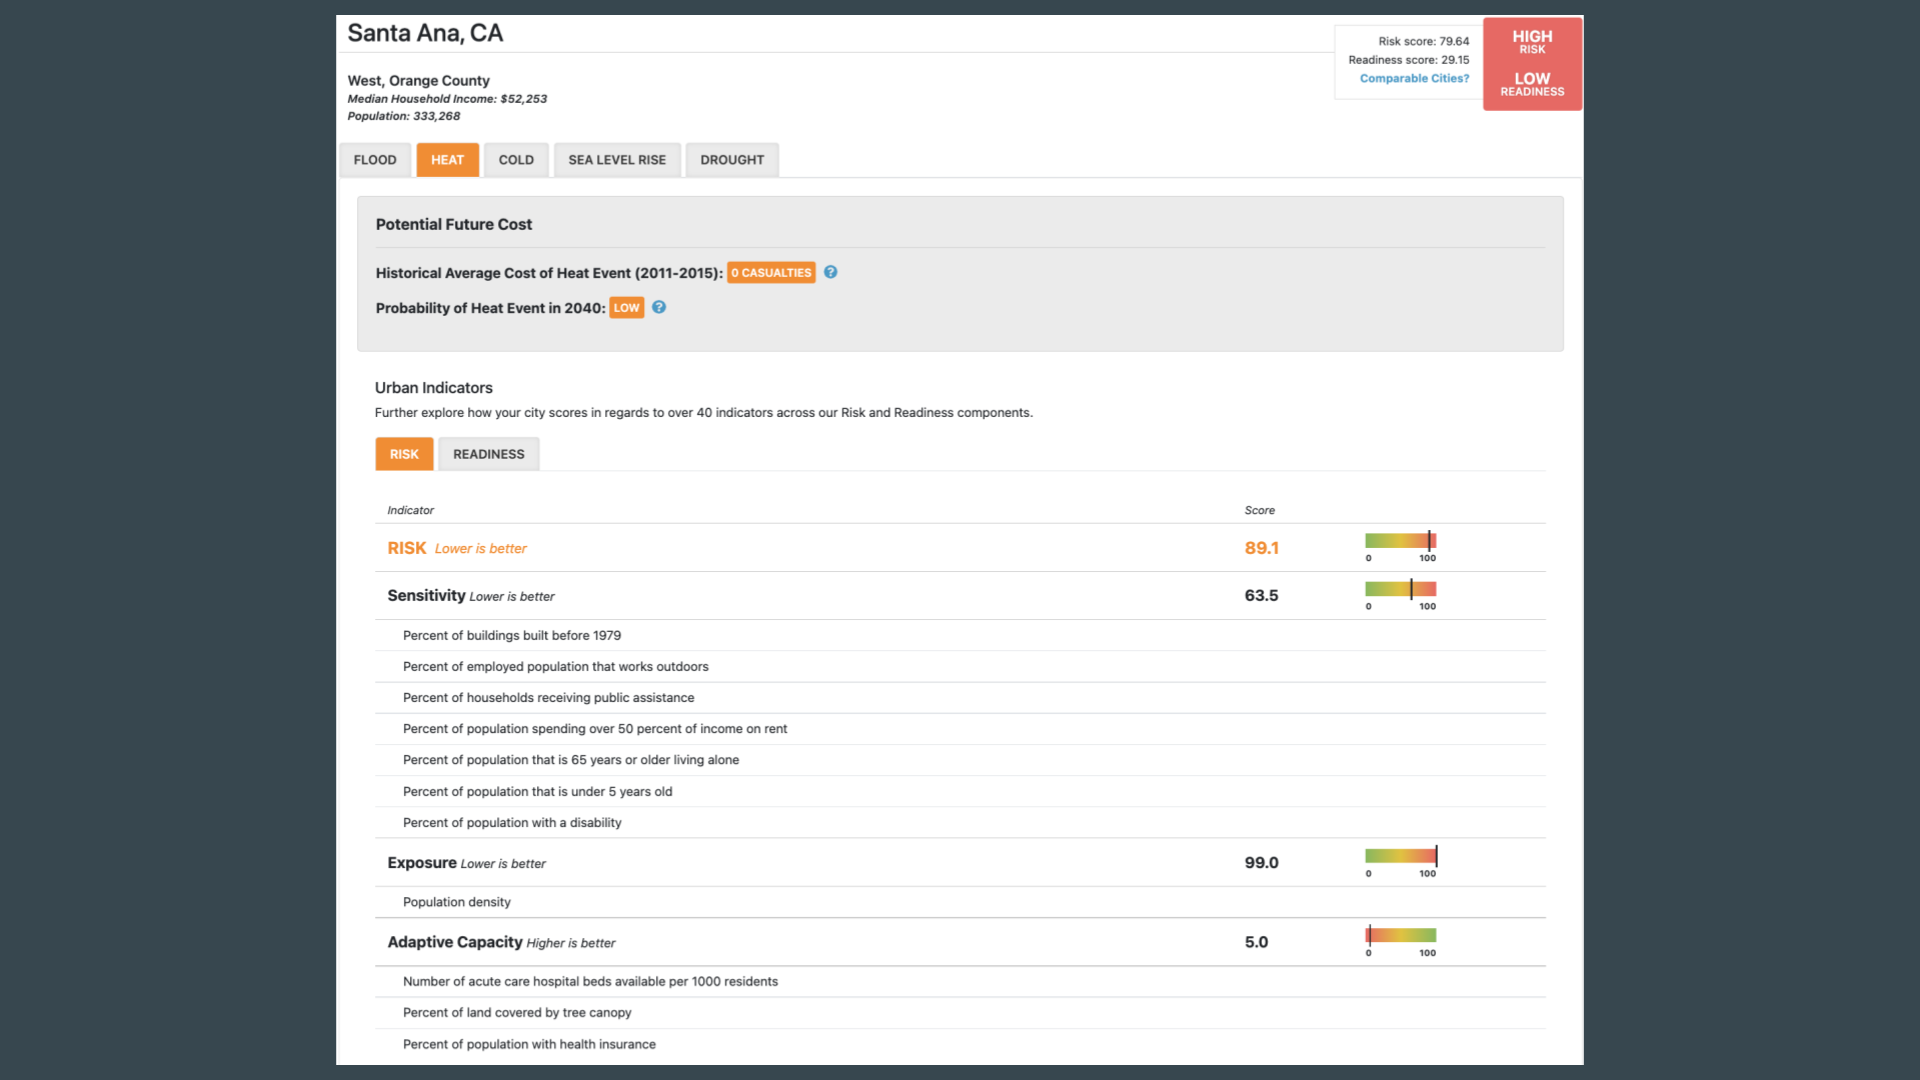
This image shows Santa Ana has an overall heating risk score of 89.1. This is based on the following indicators:
The sensitivity score is 63.5. Data points used to measure the indicator include percent of buildings built before 1979, percent of employed population that works outdoors, percent of households receiving public assistance, percent of population spending over 50 percent of income on rent, percent of population that is 65 years or older living alone, percent of population that is under 5 years old, and percent of population with a disability
The exposure score is 99.0. Data points used to measure the indicator include population density.
The adaptive capacity score is 5.0. Data points used to measure the indicator include number of acute care hospital beds available per 1000 residents, percent of land covered by tree canopy, and percent of population with health insurance.
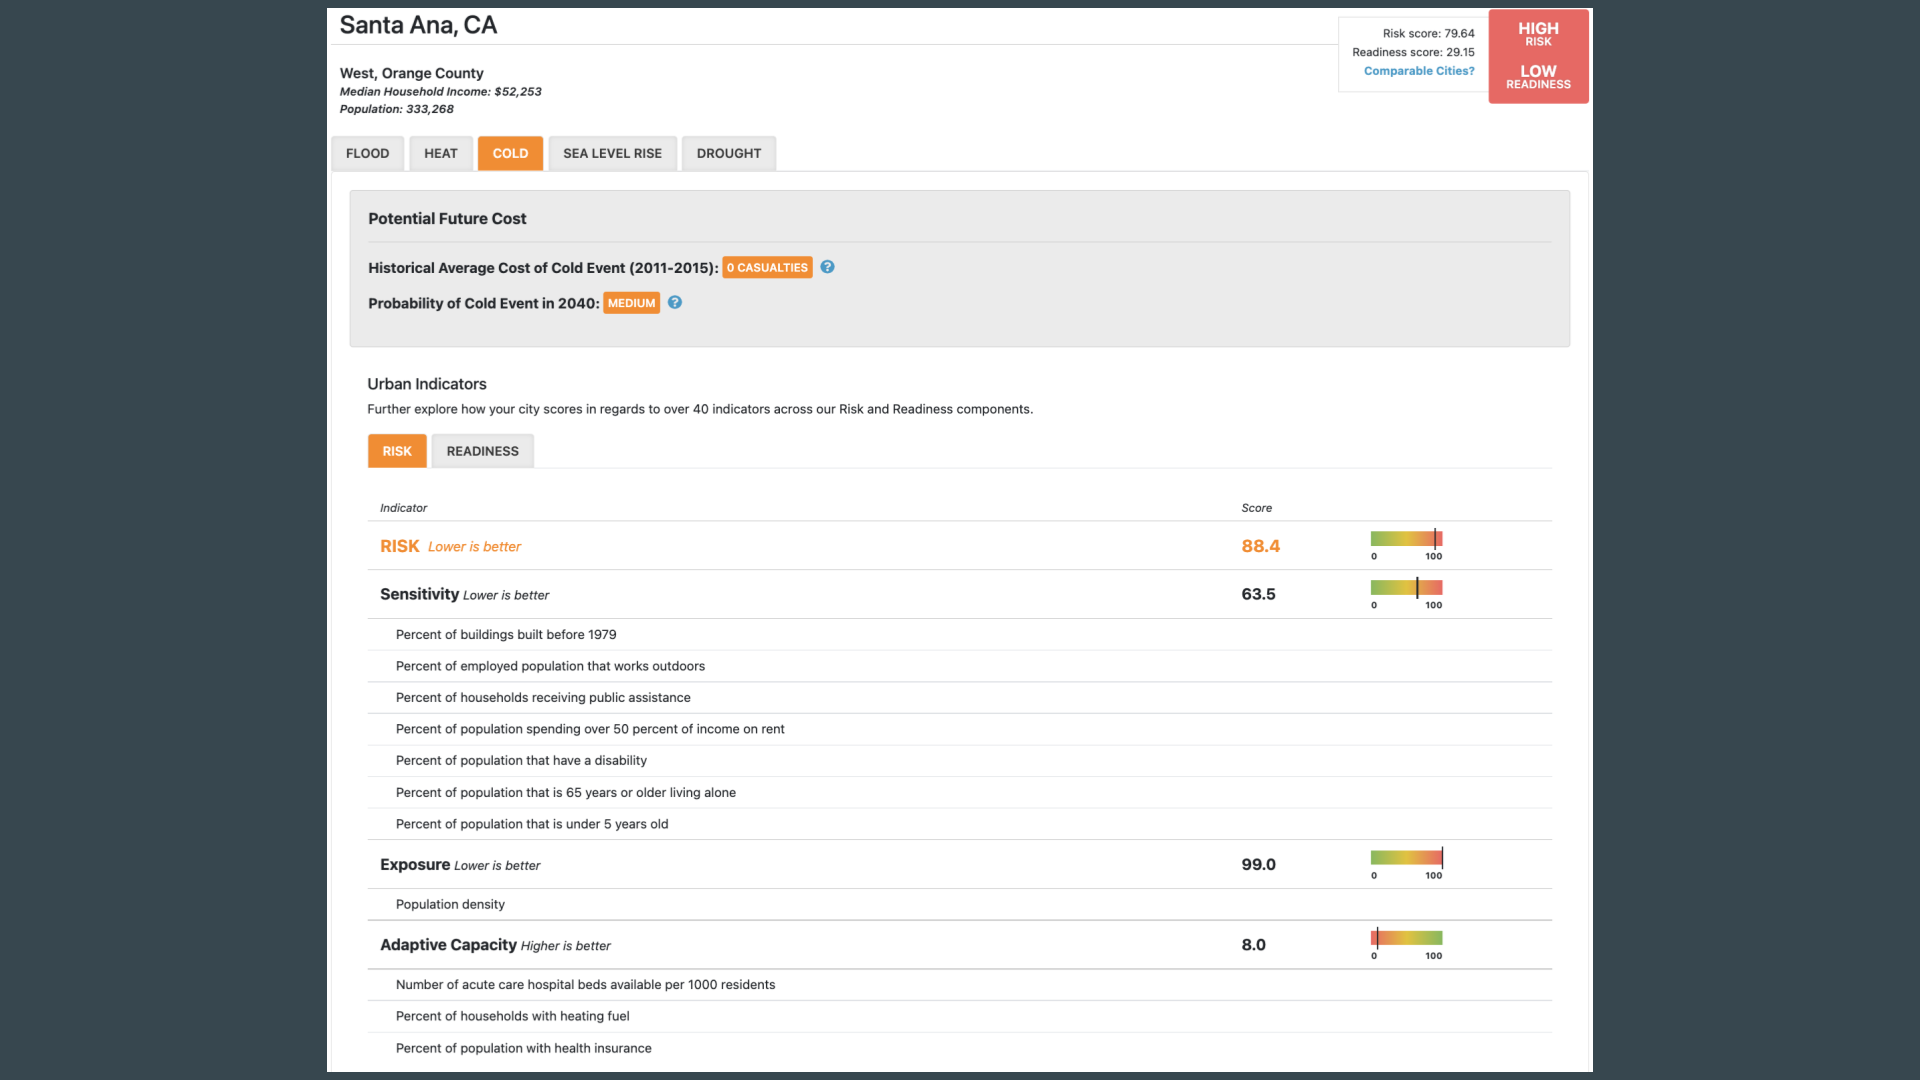
This image shows Santa Ana has an overall cold risk score of 88.4. This is based on the following indicators:
The sensitivity score is 63.5. Data points used to measure the indicator include percent of buildings built before 1979, percent of employed population that works outdoors, percent of households receiving public assistance, percent of population spending over 50 percent of income on rent, percent of population that have a disability, percent of population that is 65 years or older living alone, and percent of population that is under 5 years old.
The exposure score is 99.0. Data points used to measure the indicator include population density.
The adaptive capacity score is 8.0. Data points used to measure the indicator include number of acute care hospital beds available per 1000 residents, percent of households with heating fuel, and percent of population with health insurance.

This image shows Santa Ana has an overall sea-level rise risk score of 0. This is based on the following indicators:
The sensitivity score is 70.5. Data points used to measure the indicator include percent of area that is impervious surface, percent of buildings built before 1999, percent of households without access to a vehicle, percent of population spending over 50 percent of income on rent, percent of population that is 65 years old or older living alone, percent of population that is under 5 years old, and percent of total housing units that are mobile homes.
The exposure score is 0.0. Data points used to measure the indicator include percent of population in 1ft sea level rise zone and percent of population in 3ft sea level rise zone.
The adaptive capacity score is 21.9. Data points used to measure the indicator include number of acute care hospital beds available per 1000 residents, percent of population with health insurance, and water quality enforcement.
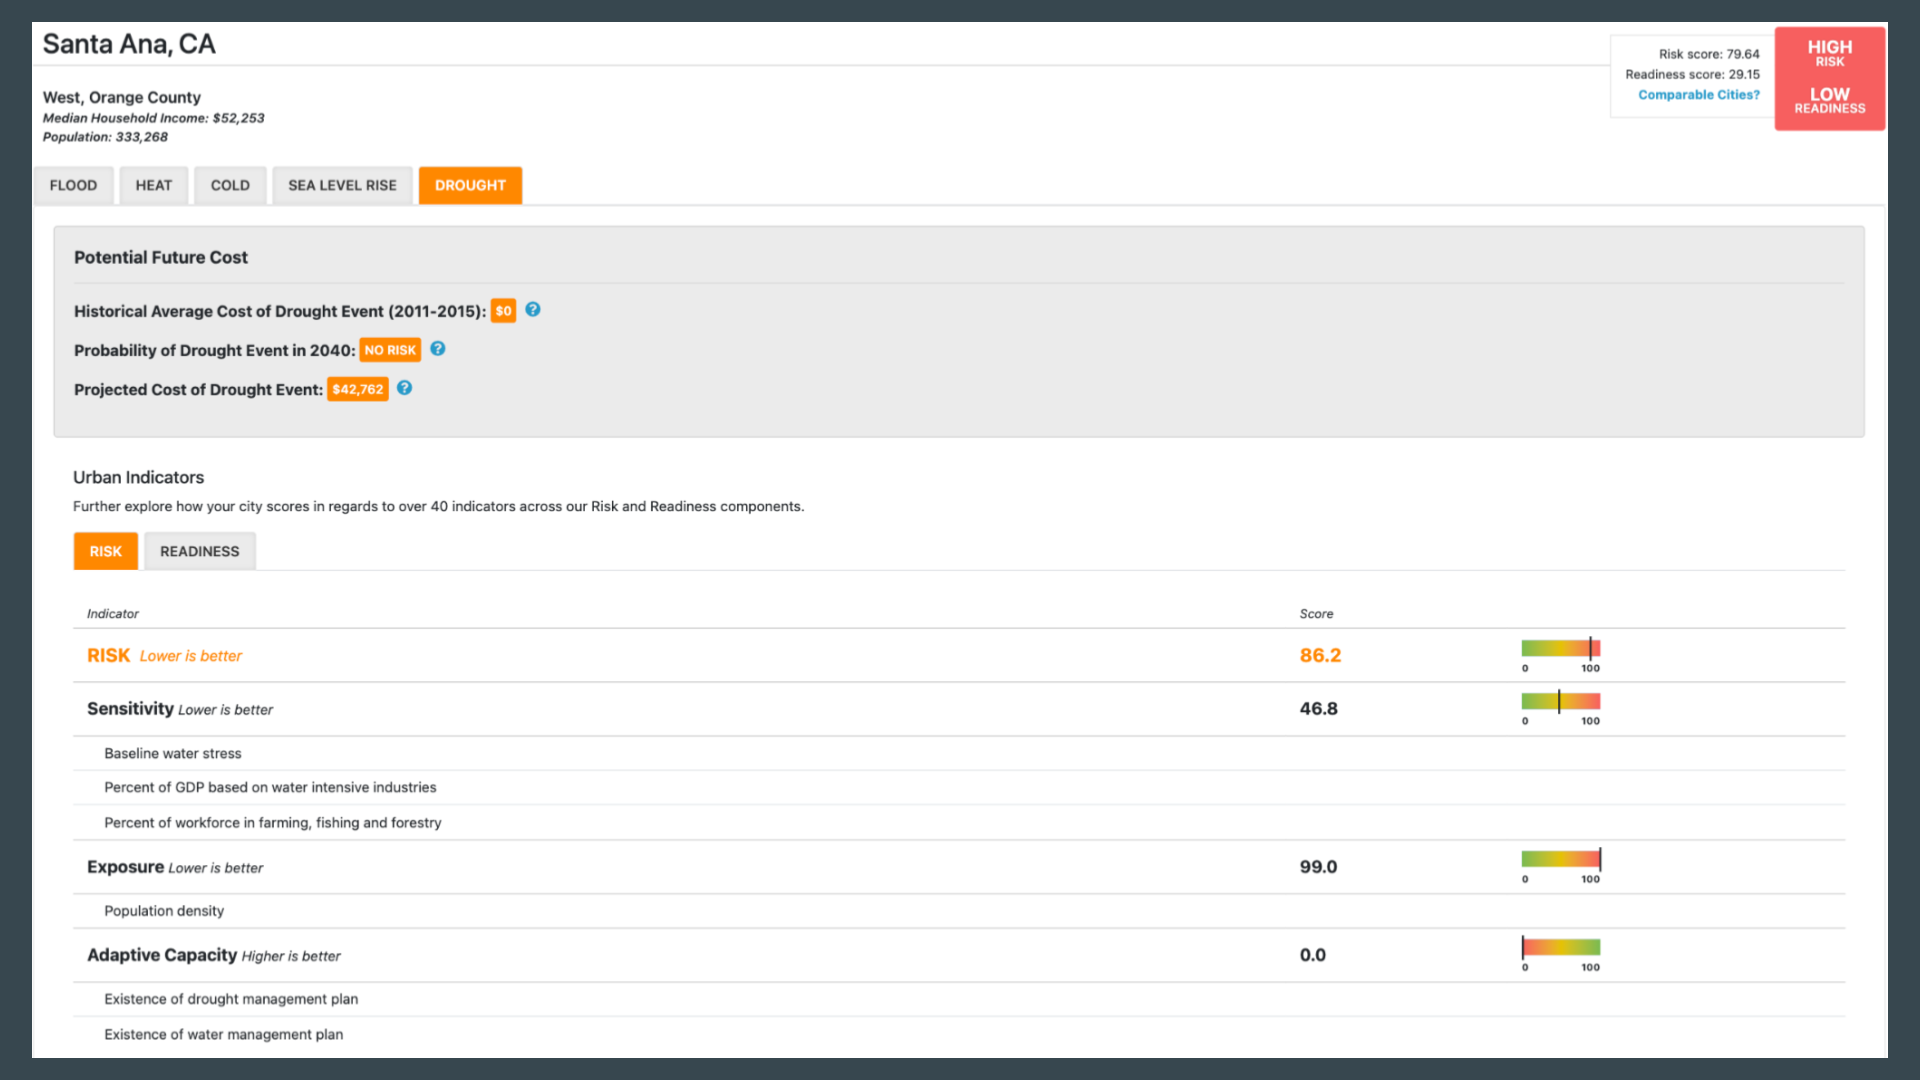
This image shows Santa Ana has an overall drought risk score of 86.2. This is based on the following indicators:
The sensitivity score is 46.8. Data points used to measure the indicator include baseline water stress, percent of GDP based on water intensive industries, percent of workforce in farming, fishing and forestry
The exposure score is 99.0. Data points used to measure the indicator include population density.
The adaptive capacity score is 0.0. Data points used to measure the indicator include existence of drought management plan and existence of water management plan.
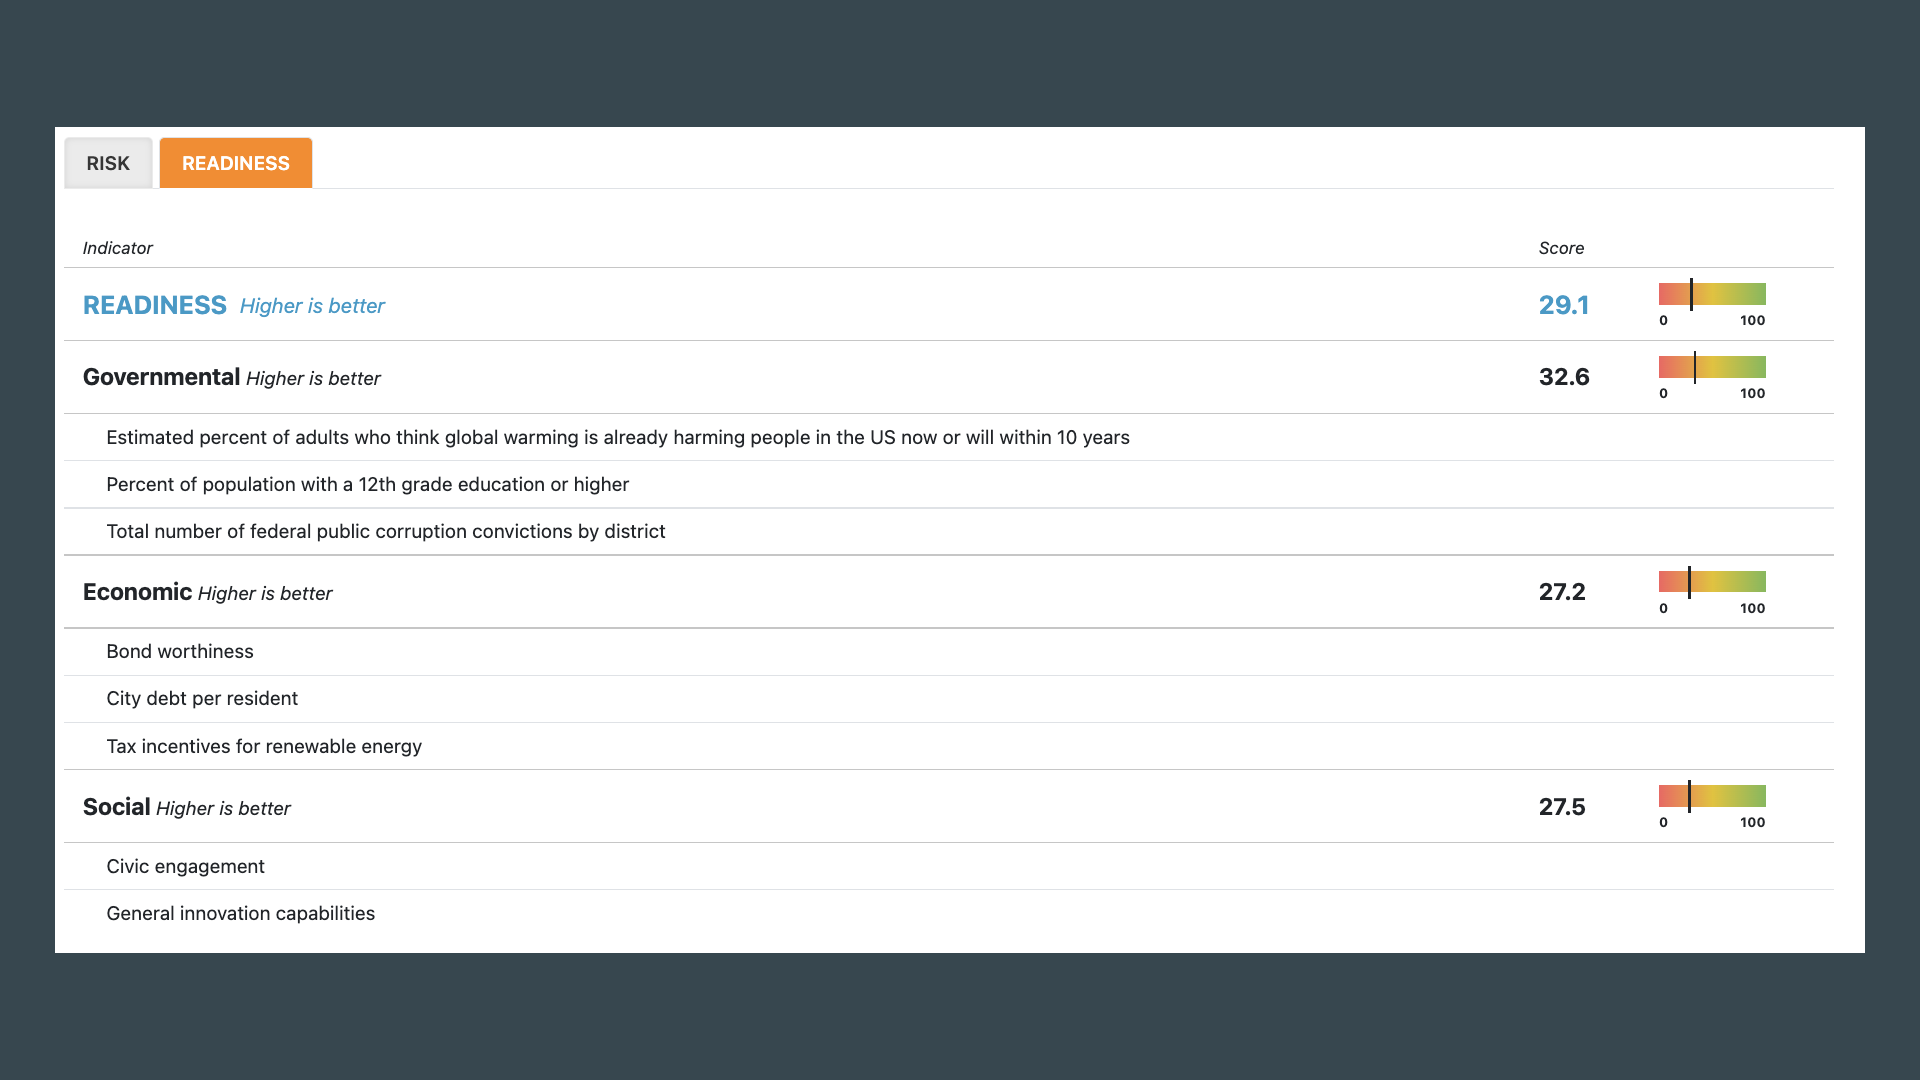
The readiness indicator is the same for all the hazards. It is based on governmental, economic, and social factors.
Santa Ana has an overall readiness score of 29.1. This is based on the following indicators:
The governmental readiness score is 32.6. Data points used to measure the indicator include estimated percent of adults who think global warming is already harming people in the US now or will within 10 years, percent of population with a 12th grade education or higher, and total number of federal public convictions by district.
The economic readiness score is 27.2. Data points used to measure the indicator include bond worthiness, city debt per resident, and tax incentives for renewable energy.
The social readiness score is 27.5. Data points used to measure the indicator include civic engagement and general innovation capabilities.

Taina Miranda Araujo. 17 March 2022, "Social Vulnerability in Santa Ana, CA ", Disaster STS Network, Platform for Experimental Collaborative Ethnography, last modified 19 January 2024, accessed 30 November 2024. http://465538.bc062.asia/content/social-vulnerability-santa-ana-ca
